


By Guest Blogger, Pete Wargent,
Next Level Wealth
No guarantees!
It’s often said that past performance is no guarantee of future performance in financial markets.
But how does this statement measure up in the property market, and what might it mean for your property strategy in 2022?
Let’s take a look…
Does past performance leave clues?
An interesting question for property investors: does past performance leave clues?
And, if so, how can we use that analysis or information to our advantage?
At the simplest level, we have many decades of figures available to show that as the population grows, productivity improves, then incomes rise over time and wealth increases in Australia’s inflationary economy.
And, over time, people tend to pay more for well-located residential land…so property prices rise accordingly.
So the theory goes, in the popular, highly sought-after land-locked locations where there is an increasing demand for housing but only a limited supply of available land, we should see property prices appreciated fastest of all, typically above the rate of inflation.
This all seems to make perfect logical sense.
But do the numbers fit the narrative?
Brisbane case study
Let’s take a look at suburb price growth over the past three decades for a selection of suburbs in the inner 10-kilometre ring of Brisbane.
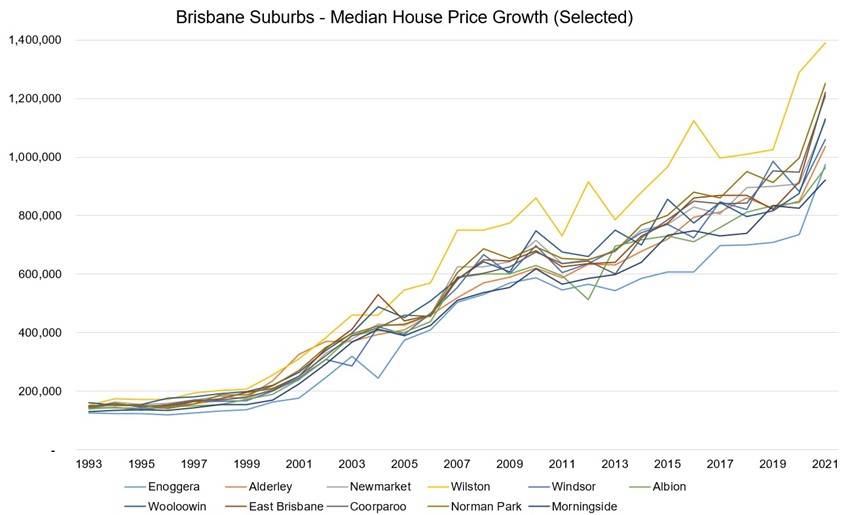
Since 1993, the strongest performer of the selected suburbs was Wilston, with capital growth for houses of over 800 per cent, for a compounding annual growth rate of just over 8 per cent.
It’s a highly sought-after area by medical professionals, being close to the Royal Brisbane hospital, and with outstanding city views being only 3 kilometres from the CBD.
There’s also a train station linking Wilston to Central in only 11 minutes, while ongoing urban renewal has made Wilston a fabulous village-style location for outdoor or fine-dining.
In short, there’s not much not to like!
From the Brisbane suburbs selected above, the ‘lowest’ capital growth was seen in Albion, where prices increased by around 600 per cent, for a compounding annual growth rate of about 7½ per cent.
Why lower? Parts of Albion have been prone to flash-flooding - and there’s been a fair bit of disruption from construction projects in recent years in parts of the suburb – but the outlook is likely to brighten as Albion becomes a key beneficiary of the Brisbane Olympics in 2032.
There a few striking takeaway points here:
Taking action could be the most decision of all; time in the market works!
Markets move in cycles, and this impacts all suburbs and locations to some degree
The annual capital growth rates appear to be more similar than different; but
Over time seemingly trivial differences in capital growth rates can add up to a surprisingly big difference, due to the powerful effects of compounding.
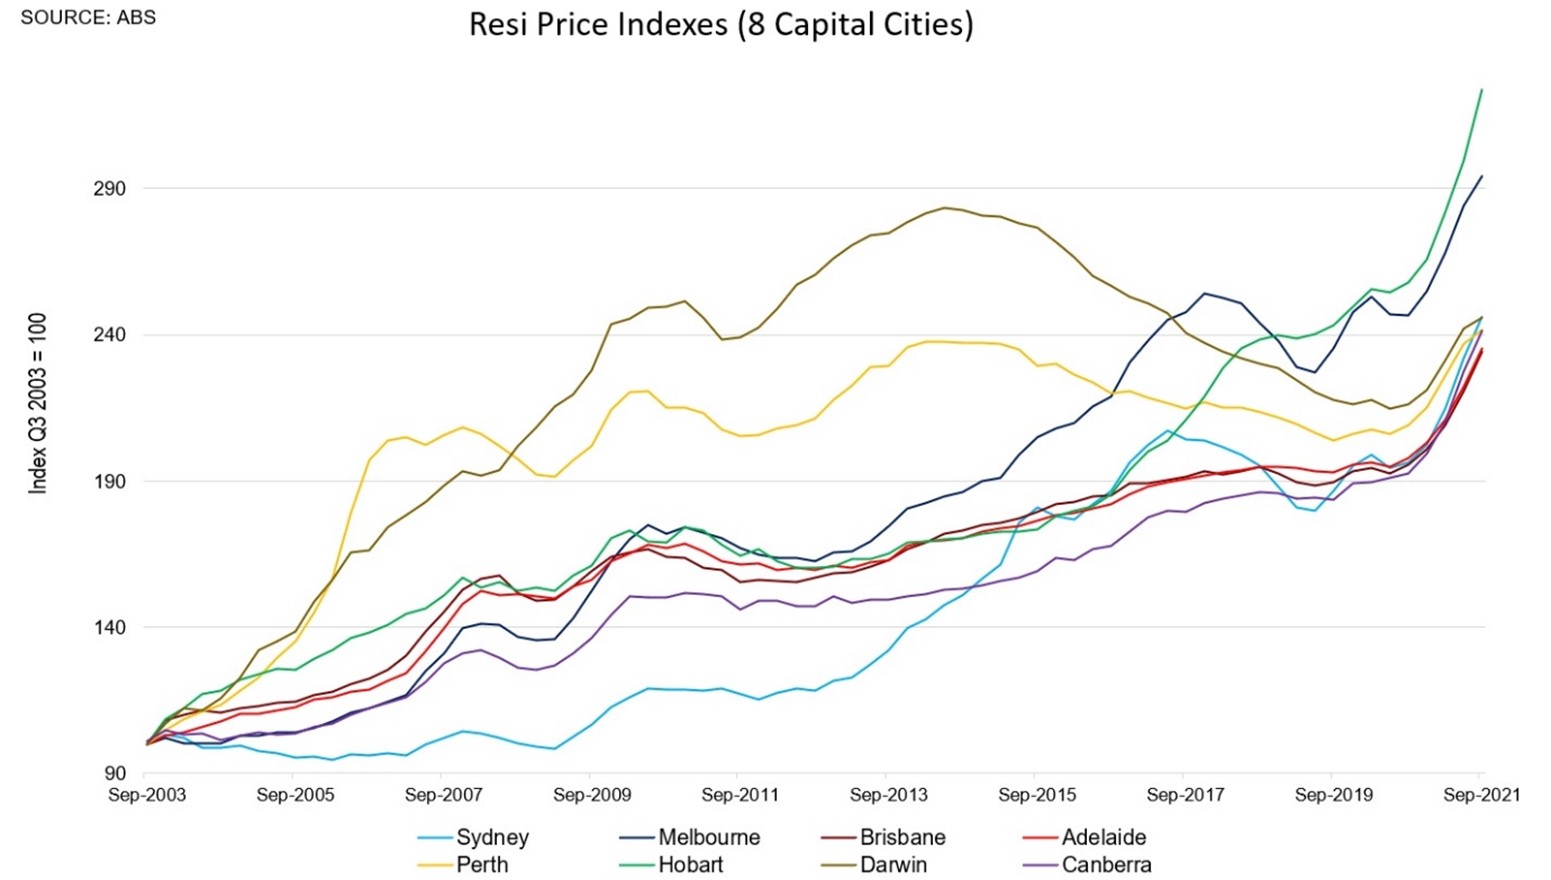
Market cycles and your starting point
When you get in to the market and when you get out also makes a difference.
In Australia, the cycles tend appear to occur at contrasting times in the resources states (such as Western Australia, and the Northern Territory) versus the states with more services-driven economies (in particular New South Wales and Victoria).
Over the long run all capital cities have been solid performers, but the starting point does have some impact.
For example, if you picked the late 1990s as your starting point Sydney has delivered spectacular returns.
But since 2003, Melbourne and especially now Hobart have been stronger performers than Sydney; so investors would probably look to catch the respective waves where possible.
For most investors it will probably take two full cycles to generate meaningful wealth in property: a first cycle to build some initial equity, which can then be used to leverage into a second cycle, perhaps with a more diversified portfolio of properties.
The missing nuance
Over the long run since 1993, the top performing suburbs lists in Brisbane have generally been dominated by the so-termed ‘blue-chip’ locations: Bulimba, New Farm, Hawthorne, Grange, Hamilton, and Paddington, for example.
One of the shortcomings of using data in this manner is that the median price figures at the suburb level can be distorted, particularly by renovations and home improvements, rezoning, or other changes in the composition of the dwelling stock.
When you think about it, using a suburb or a postcode is also a very arbitrary method of dis-aggregating property prices.
While there may be an element of ‘postcode snobbery,’ there’s no logical reason properties located one street apart but across a suburb boundary should perform very differently.
Local factors
At the local level other factors can make a meaningful difference.
In Brisbane, for example, the Mansfield State High School catchment is a local factor which has seen a tremendous out performance in land values and property prices within the suburb of Wishart, with median house prices in the suburb rising dramatically by 150 per cent between 2006 and 2021.
Migration and interest from Chinese buyers saw Sunnybank become a powerfully performing location between 2011 and 2018 with the median house price surging from $500,000 to $836,500 for capital growth of 67 per cent.
Since then, a crackdown on foreign investment via the stamp duty surcharge and the drop in international students and Chinese tourism may have had a corresponding cooling impact on the local housing market demand.
These are examples of factors which can see a surge in local demand.
On the other hand, areas which are prone to flooding can be adversely impacted in flood years, busy roads can be seen as less popular locations for families, and so on.
In summary…
Summing up, analysing median prices at the suburb level can be a useful starting point.
But local nuance and expertise is always going to be important too.
The most powerful buying demographic tends to be families, so family-appropriate housing in well-serviced, land-locked locations will generally fare well over the long run.
If you have a shorter time horizon in mind, it can pay to look for local factors, such as a gentrification play, potential zoning changes, an increasingly popular school zone, or a notable demographic shift.
Finally, don’t forget ‘X factors’ – the past couple of years should have been a salient reminder for us to expect the unexpected!
To have one of the friendly Propertybuyer Buyers' Agents to contact
you in regards to buying property :
 or
or
call on 1300 655 615 today.


.svg)
.svg)
.svg)


